This was the first graph we walked and it mapped distance. Therefore, the higher the line is on the graph, the farther we go from the motion detector. A straight line means we stand still and decreasing/increasing lines means going closer or farther from the detector. So, we start at 1m away from the detector, and walk 2.8m away from the detector in 3 seconds. Then stand still at that spot for 3 seconds. Then walk back to 1.8m away from the detector in 1 second. Then stand still for 3 more seconds.
This is the second graph we walked, also in distance. We start at 3m away from the motion detector and move to 1.5m away from the detector in 3 seconds. Then stand still for 1 second. Then walk 0.5m away from the detector in 1 second. Stand still for 2 seconds. Then walk back to the origin of 3m in 3 seconds. However, our group did not stand at the exact spots and it got messed up at the end.
This graph calculated velocity and was probably the hardest one we attempted. Basically, vertical lines indicates the direction and the speed at which you go in that direction. Horizontal lines mean keep a constant speed. Start by standing still for 2 seconds. Then walk backward at 0.5m/s in less than a second. Keep walking backward at 0.5m/s for 3 seconds and then stop for 2 seconds. Walk in the other direction at 0.5m/s and maintain that speed for 3 seconds. This was extremely hard as keeping a constant speed was very difficult.
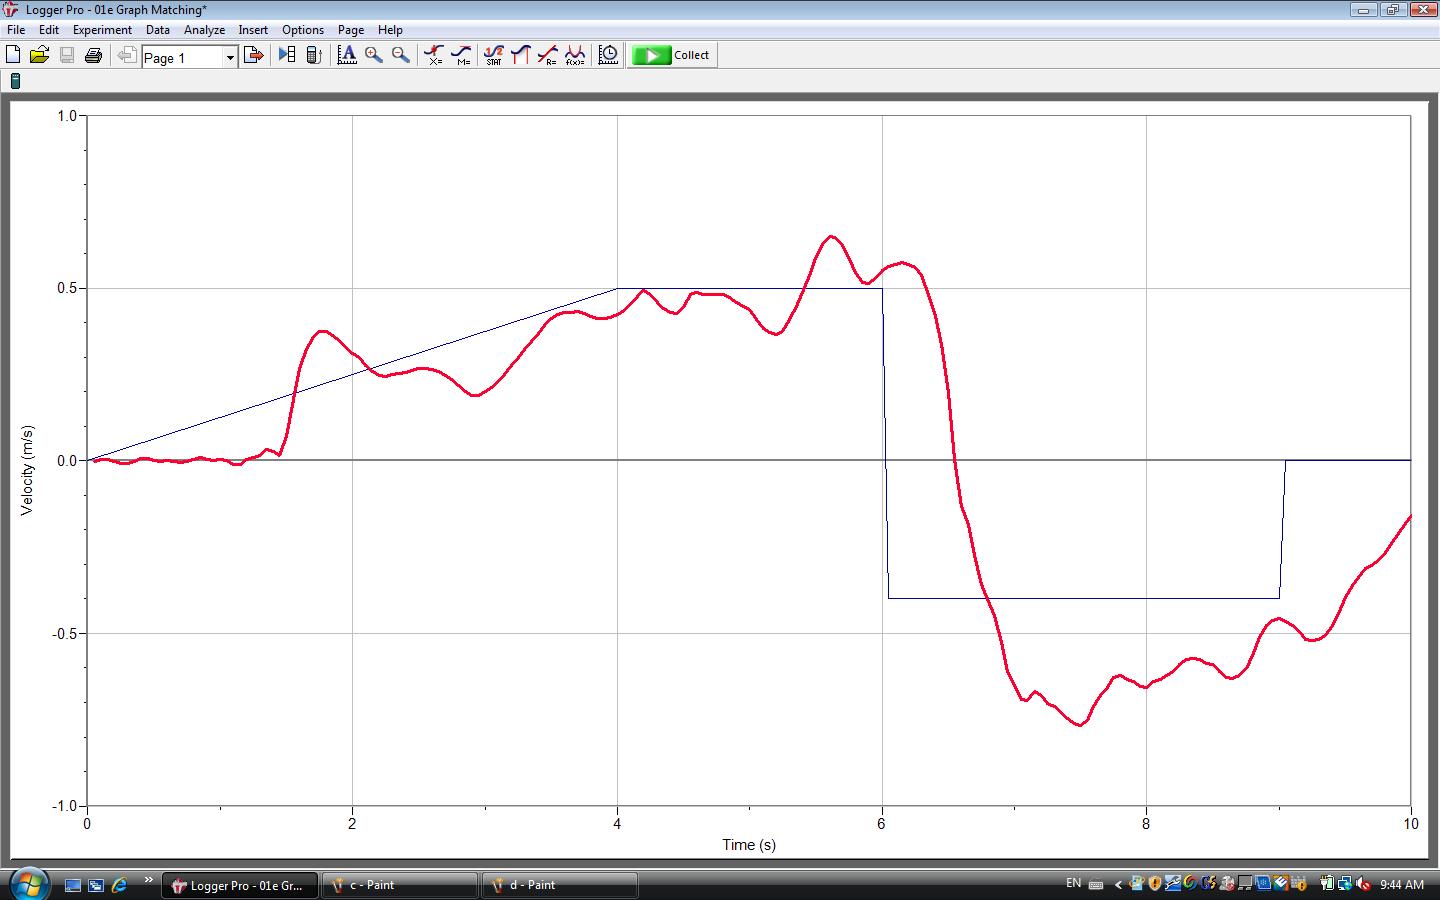
Another velocity graph which was as difficult as the last one. Start moving backward increasing speed as you walk peaking at 0.5m/s for 4 seconds. Stay at the peak speed for 2 seconds. Go forward at 0.5m/s in 3 seconds. Move backward decreasing speed until standing still in 1 second.
The last graph which mapped distance. Start a little less than 1m away from the detector and go to 1.9m away in 3.5 seconds. Stay at that location for 4 seconds. Then walk backward to 3.2m in 3.5 seconds.